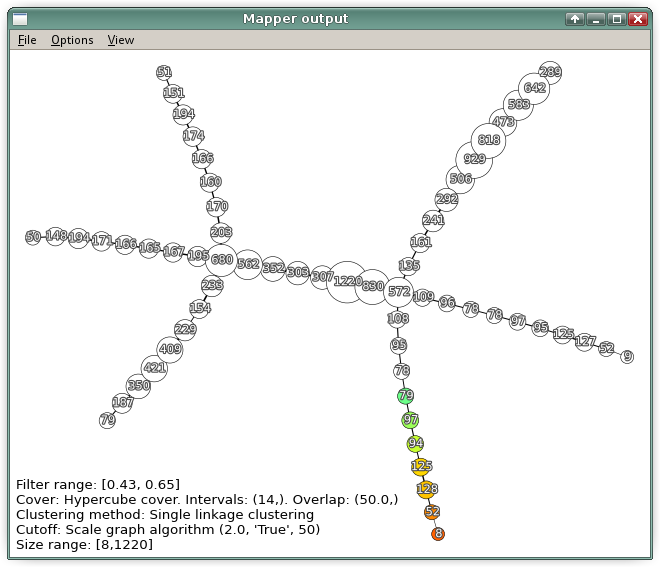
The Mapper output window
Here is a typical Mapper output from one of the toy examples (the horse):
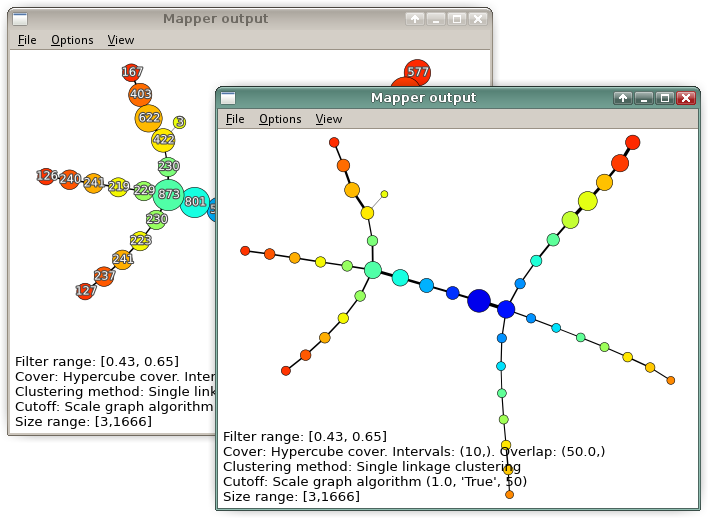
Node highlighting
Click on a node to highlight it.
Shift-Click allows to select and de-select multiple nodes.
Click on the white background to reset the selection.
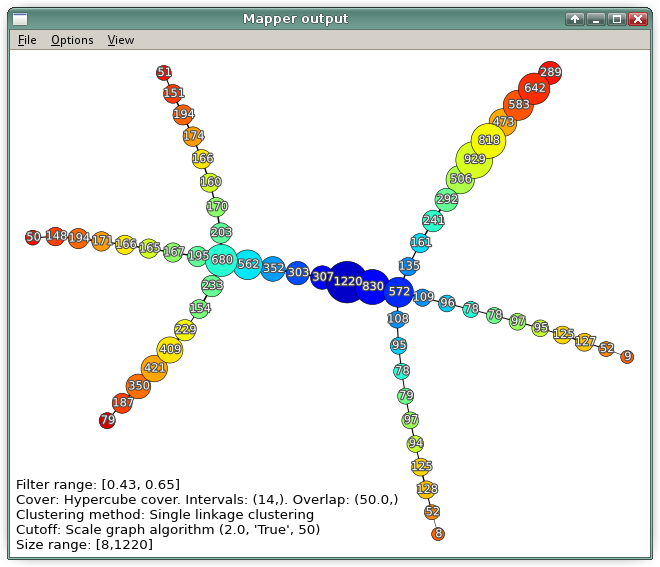
Keyboard navigation
L selects all nodes in the same level set(s) as the currently highlighted node(s).< moves to the next lower level set.> moves to the next higher level set.
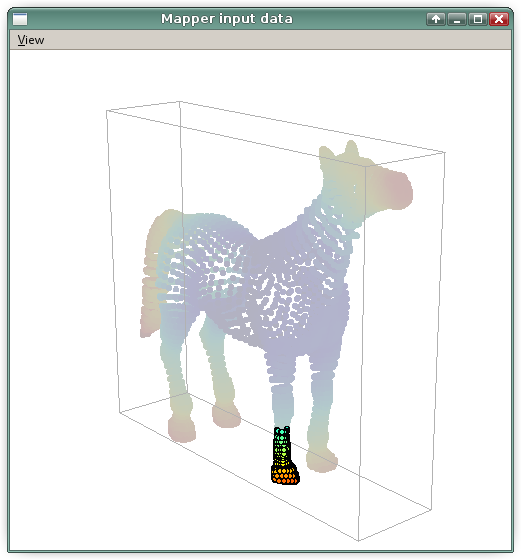
When 2- or 3-dimensional data is displayed, the data points in the selected nodes are highlighted accordingly.
The identities of the selected data points can be saved to a file, see Save highlighted nodes below.