Quick start
- Python Mapper has two different user interfaces: It provides a graphical interface, which conveniently bundles all steps like data input, computation of a filter function, the scale graph display, the Mapper step, visualization etc. on one screen, with all choices and parameters clearly laid out. This is a great, convenient way to explore a data set. Intermediate results are stored, so the interface also saves much time. For example, the filter function is not recomputed over and over again when the Mapper algorithm is re-run with changed parameters.
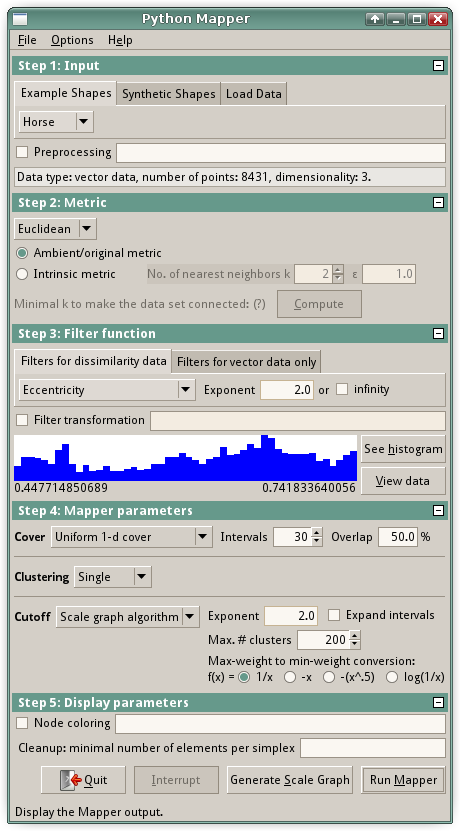
- The graphical user interface is in
mapper/bin/MapperGUI.py. Here is a screenshot:
- The second way to use Python Mapper is to import it as a Python module and write your own scripts. Writing your own script for a task is not as convenient, but it allows of course to change and extend the toolchain in the most flexible way.
- The GUI supports 1-dimensional filter functions. However, the Mapper implementation in the Python module has been written for filter functions of any dimensionality. There are also methods to draw the output from 2-dimensional Mapper. (Still to be documented.)
- Python Mapper is still under development! Nothing is stable yet.
- The distribution does not come with explicit example scripts. However, see the next item how to generate a multitude of useful code examples.
- For more complicated tasks which cannot be done with the options provided in the GUI, it is always possible to run Mapper tasks in plain Python scripts. Produce an example script with the menu item File→Generate standalone Python script. This function generates Python code that performs exactly the same steps as the current parameters in the GUI. This provides a useful starting point and, with different GUI parameters, produces many examples how various features of the Python Mapper toolchain are employed from a Python script.
|